Distant viewing
Digital images consist of pixels, which is data that you can computationally analyse to find patterns within and between pictures. In the first part we will discuss patterns between pictures, which is in the context of visual studies is called “distant viewing”.
An accessible introduction is the book Distant Viewing - Computational Exploration of Digital Images. In chapter 2, the authors explain that before analysing images you first need to extract information, a process they call annotation which I rather replace with computational annotation as we obviously can also annotate with humans (crowdsourcing could solve a scaling problem and it would still be possible to do ‘distant’ viewing, i.e. compare a relatively large body of pictures).
In this pictorial research paper, which focused on human annotations, a clarifying scheme is shown:
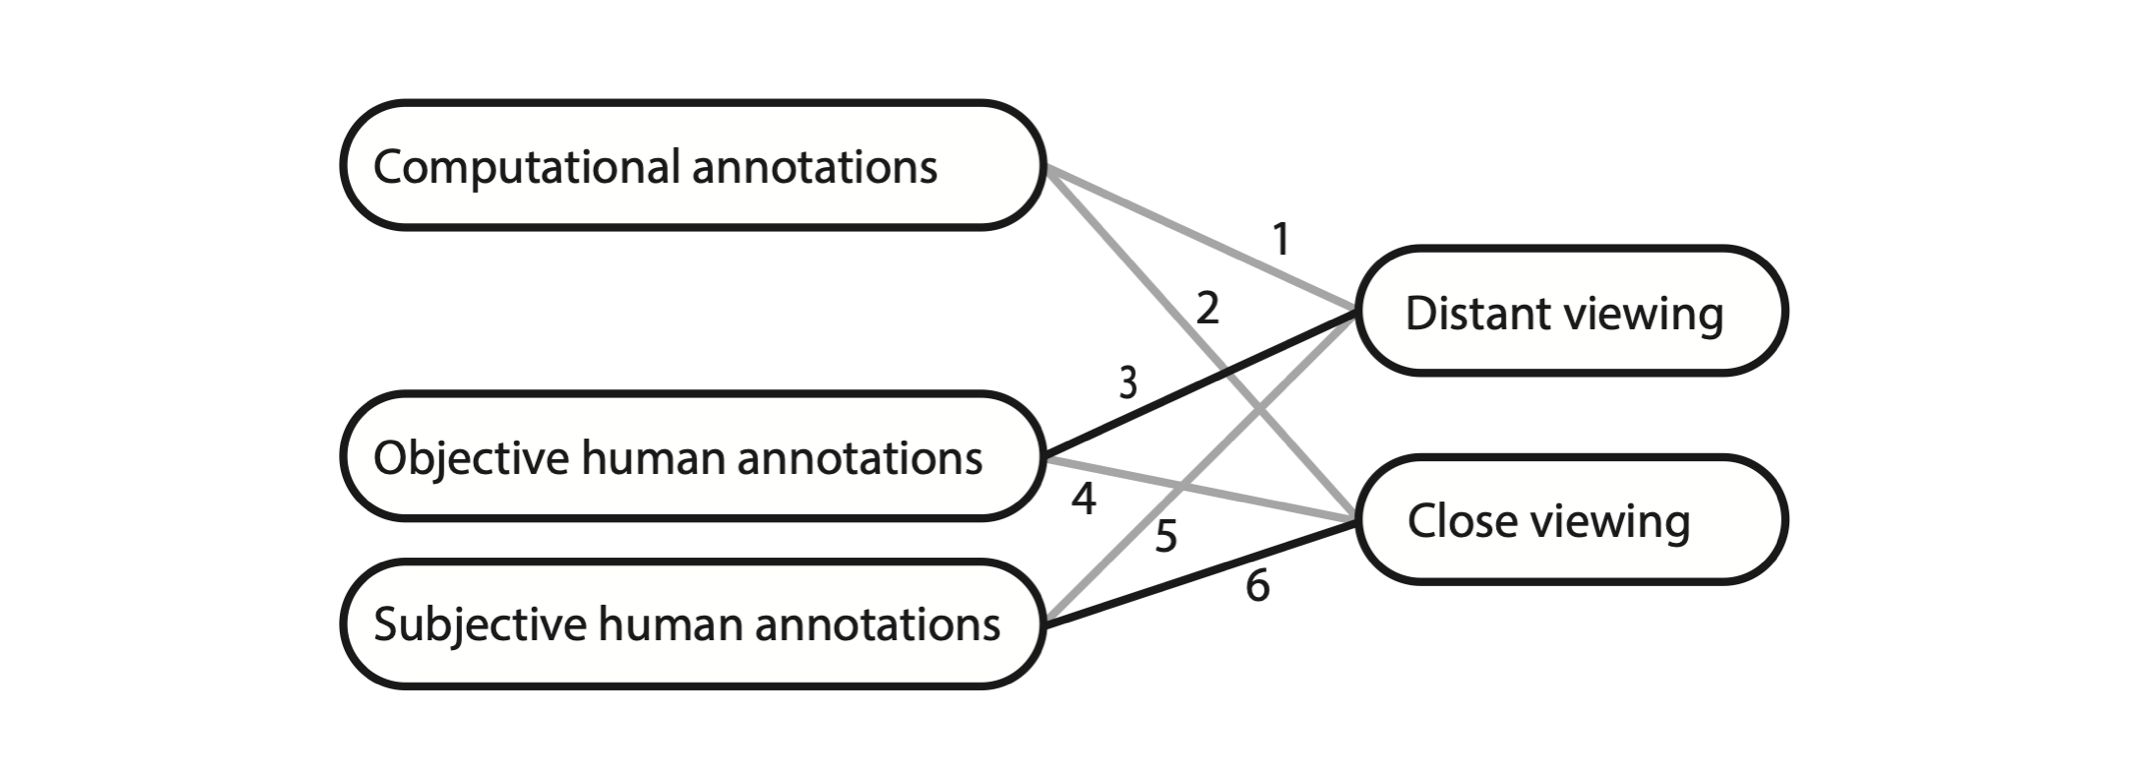
In sum: you can do either close or distant viewing either with human or machine eyes, with the marked difference that for the human eye we can dissociate between objective and subjective annotations. The numbers in the figure denoted all the possible combinations of which the paper discussed the bold lined ones.
We will use python notebooks via google colab. Some advantages of google colab is that computation happens in the cloud (i.e. you do not need a powerful computer), you can easily access image folders from your google drive and I can share code (and datasets) with you. I made three very basic python notebooks that explain computational distant viewing, and that can be used for your own image sets.
Example datasets
I created some example datasets on google drive. They generally contain small images (but not all so check before you run code) and in most cases the lack metadata. The reason for that is to keep it simple (and I did not yet have time to create something easily accessible)
- Getty paintings which are about 400 painting images, quite small so easy to load. They obviously originate from the Getty.
- BMW cars a small subset of a BMW pictures set I found at Kaggle
- Depicted faces taken from the 4tu data repository and related to a paper where we analysed posture and colour of depicted faces.
- Flora from the Materials in Paintings dataset.
- Movie posters originally from this Kaggle repository.
How to load images from google drive
You can copy the above folders to your own google drive (there does not seem a way to mount a public drive). To give the colab notebook access to your drive you have to ‘mount’ it like:
from google.colab import drive
drive.mount('/content/gdrive')
This will result in a pop-up where you need to login and give colab access to your drive. You do not have to check the boxes, only permit access to the files in your google drive. These lines of code are in all notebooks below.
Example 1: Average image calculation
An interesting way of finding patterns in image collections is taking the average. Per pixel you literally compute the average value, and you thus need to have images of exactly similar dimensions. Don’t worry, image resizing is automatically done in the notebook.
I think it is always interesting to take an average image, but you will notice that it does not always give satisfying insights: it really depends on your dataset! For faces it obviously works well, for movie posters much less, you can probably imagine why.
The first time as saw an average picture was in a paper by Aude Oliva and Antonio Torralba, and one of the authors made gallery and the artist Jason Salavon has made various average images since the 90’s. Besides aesthetic appeal, they certainly let you ‘distant view’ an image set, for example this paper visualised differences across time in portrait painting.
Here I used the code to create an average image of the bmw image set:
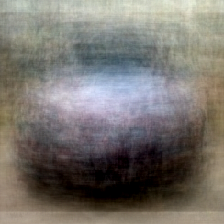
It does not show much except the intuition that photos of BMWs (or cars in general) have varying vantage points, something we also found in a later analysis where we let a neural network map the most salient differences (where vantage point seemed to play an important role). Note that vantage point variation is not necessarily trivial, some things you only photograph from certain angles, such as a face: you hardly see portraits of backsides of human heads (yes, i know what you were thinking).
Example 2: Mean color variations
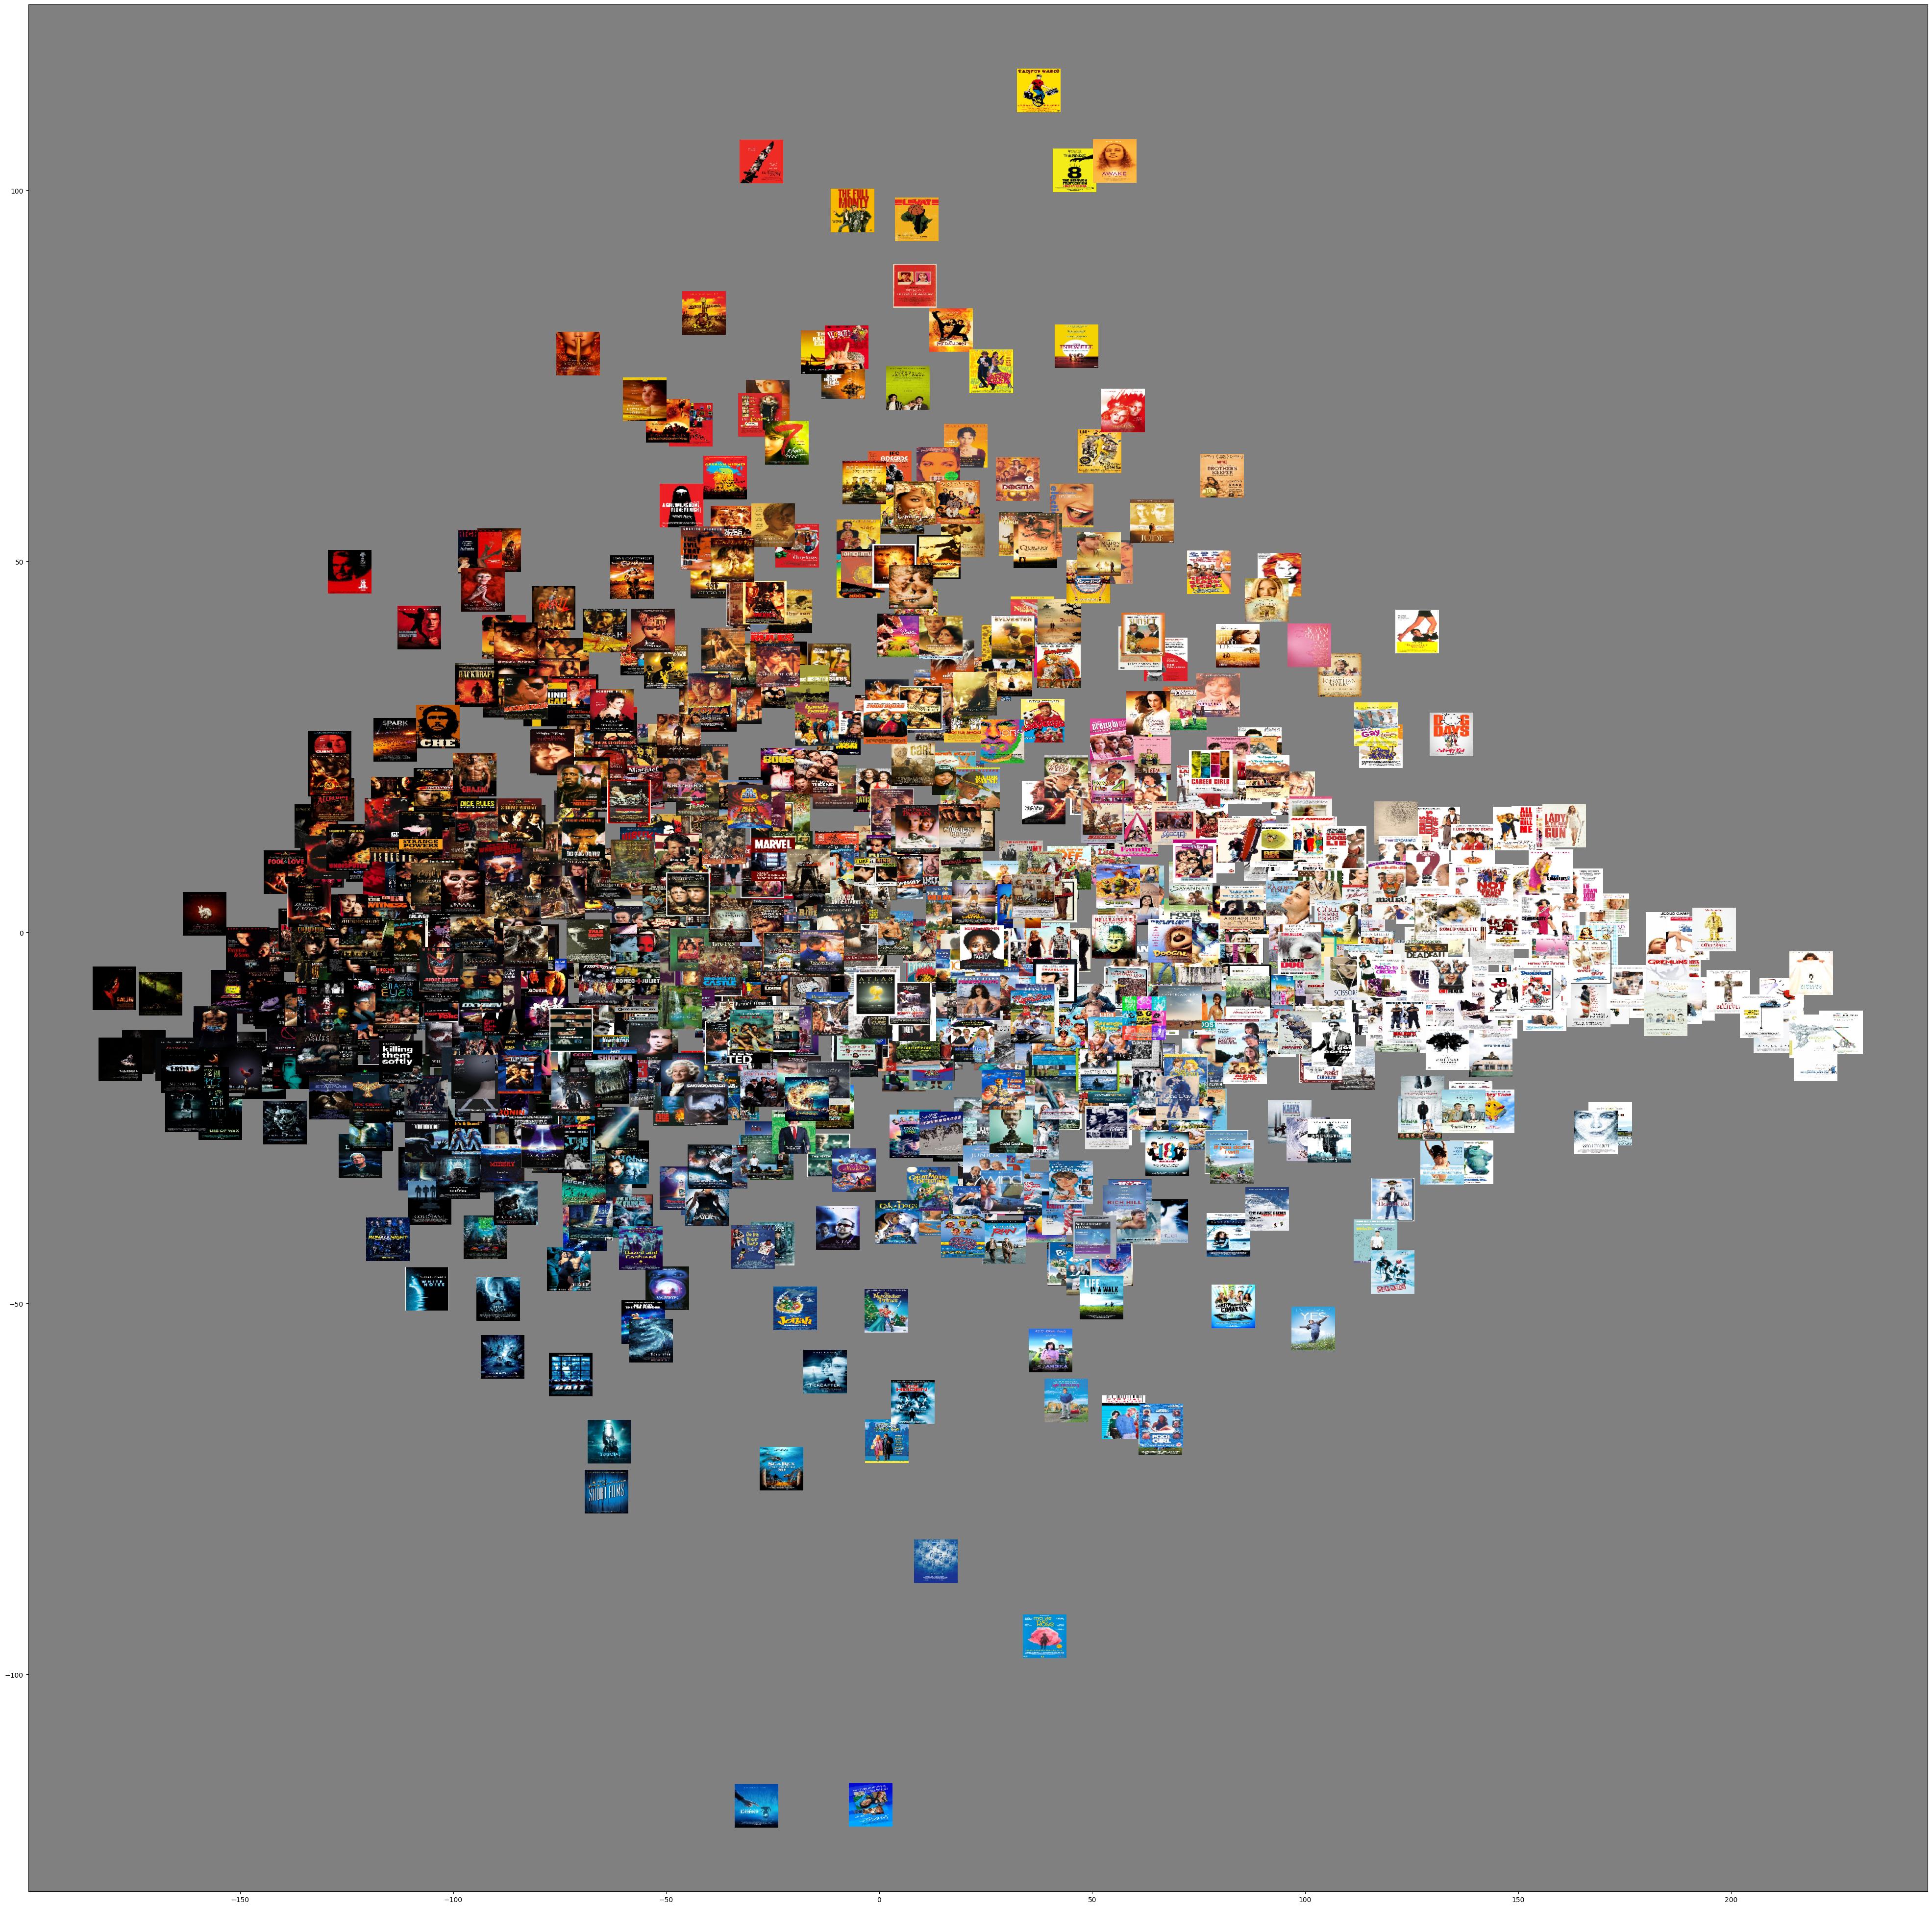
The first case study discussed in Distant Viewing - Computational Exploration of Digital Images concerns the design of movie posters, and in particular their usage of colours. Let’s try to loosely replicate their analysis.
From the images we can collect all kinds of color data, for example the mean color channels. Depending on the color space you are woking in, that could be red, green and blue or hue, saturation and value for RGB and HSV spaces, respectively. To get an intuition whether these computations make sense, and align with what we see with our own eyes, we use the thumbnail posters as coordinate markers. Here is a plot of the mean red against green:
It looks pretty cool, and also like we are on to something because … there is a clear pattern! This is called a correlation: red and green are correlated, when a poster has much red, it also has much green. Now an important ‘dimensional reduction’ procedure can be of help: Principle Component Analysis. In this case we start with three dimensions (red, green and blue) and we end up with three dimensions that are decorrelated. Without going in too much detail let’s just check out the result:
What are the axes now? Indeed, on the x-axis we see brightness. On the y axis there seems to be a gradient from blue to red/yellow. So what would happen if we plot the second and third PCA dimension in one plot? Something with colour opponency?!
Example 3: VGG19 and tSNE
In the previous example, the mean colours are the ‘annotations’ of the image which consists of three values (RGB in our case). We used PCA to decorrelate these values, but also to reduce the number of ‘dimensions’ of the annotation. PCA is just one of many dimensional reduction techniques that exist n data science. The nice thing about the PCA is that you can try to interpret the axes: they can be meaningful. In the previous example it looked a little bit that the PCA dimensions related to opponent colours, and we certainly found that the first axis (which is always the most important PCA dimension) was grayscale (brightness).
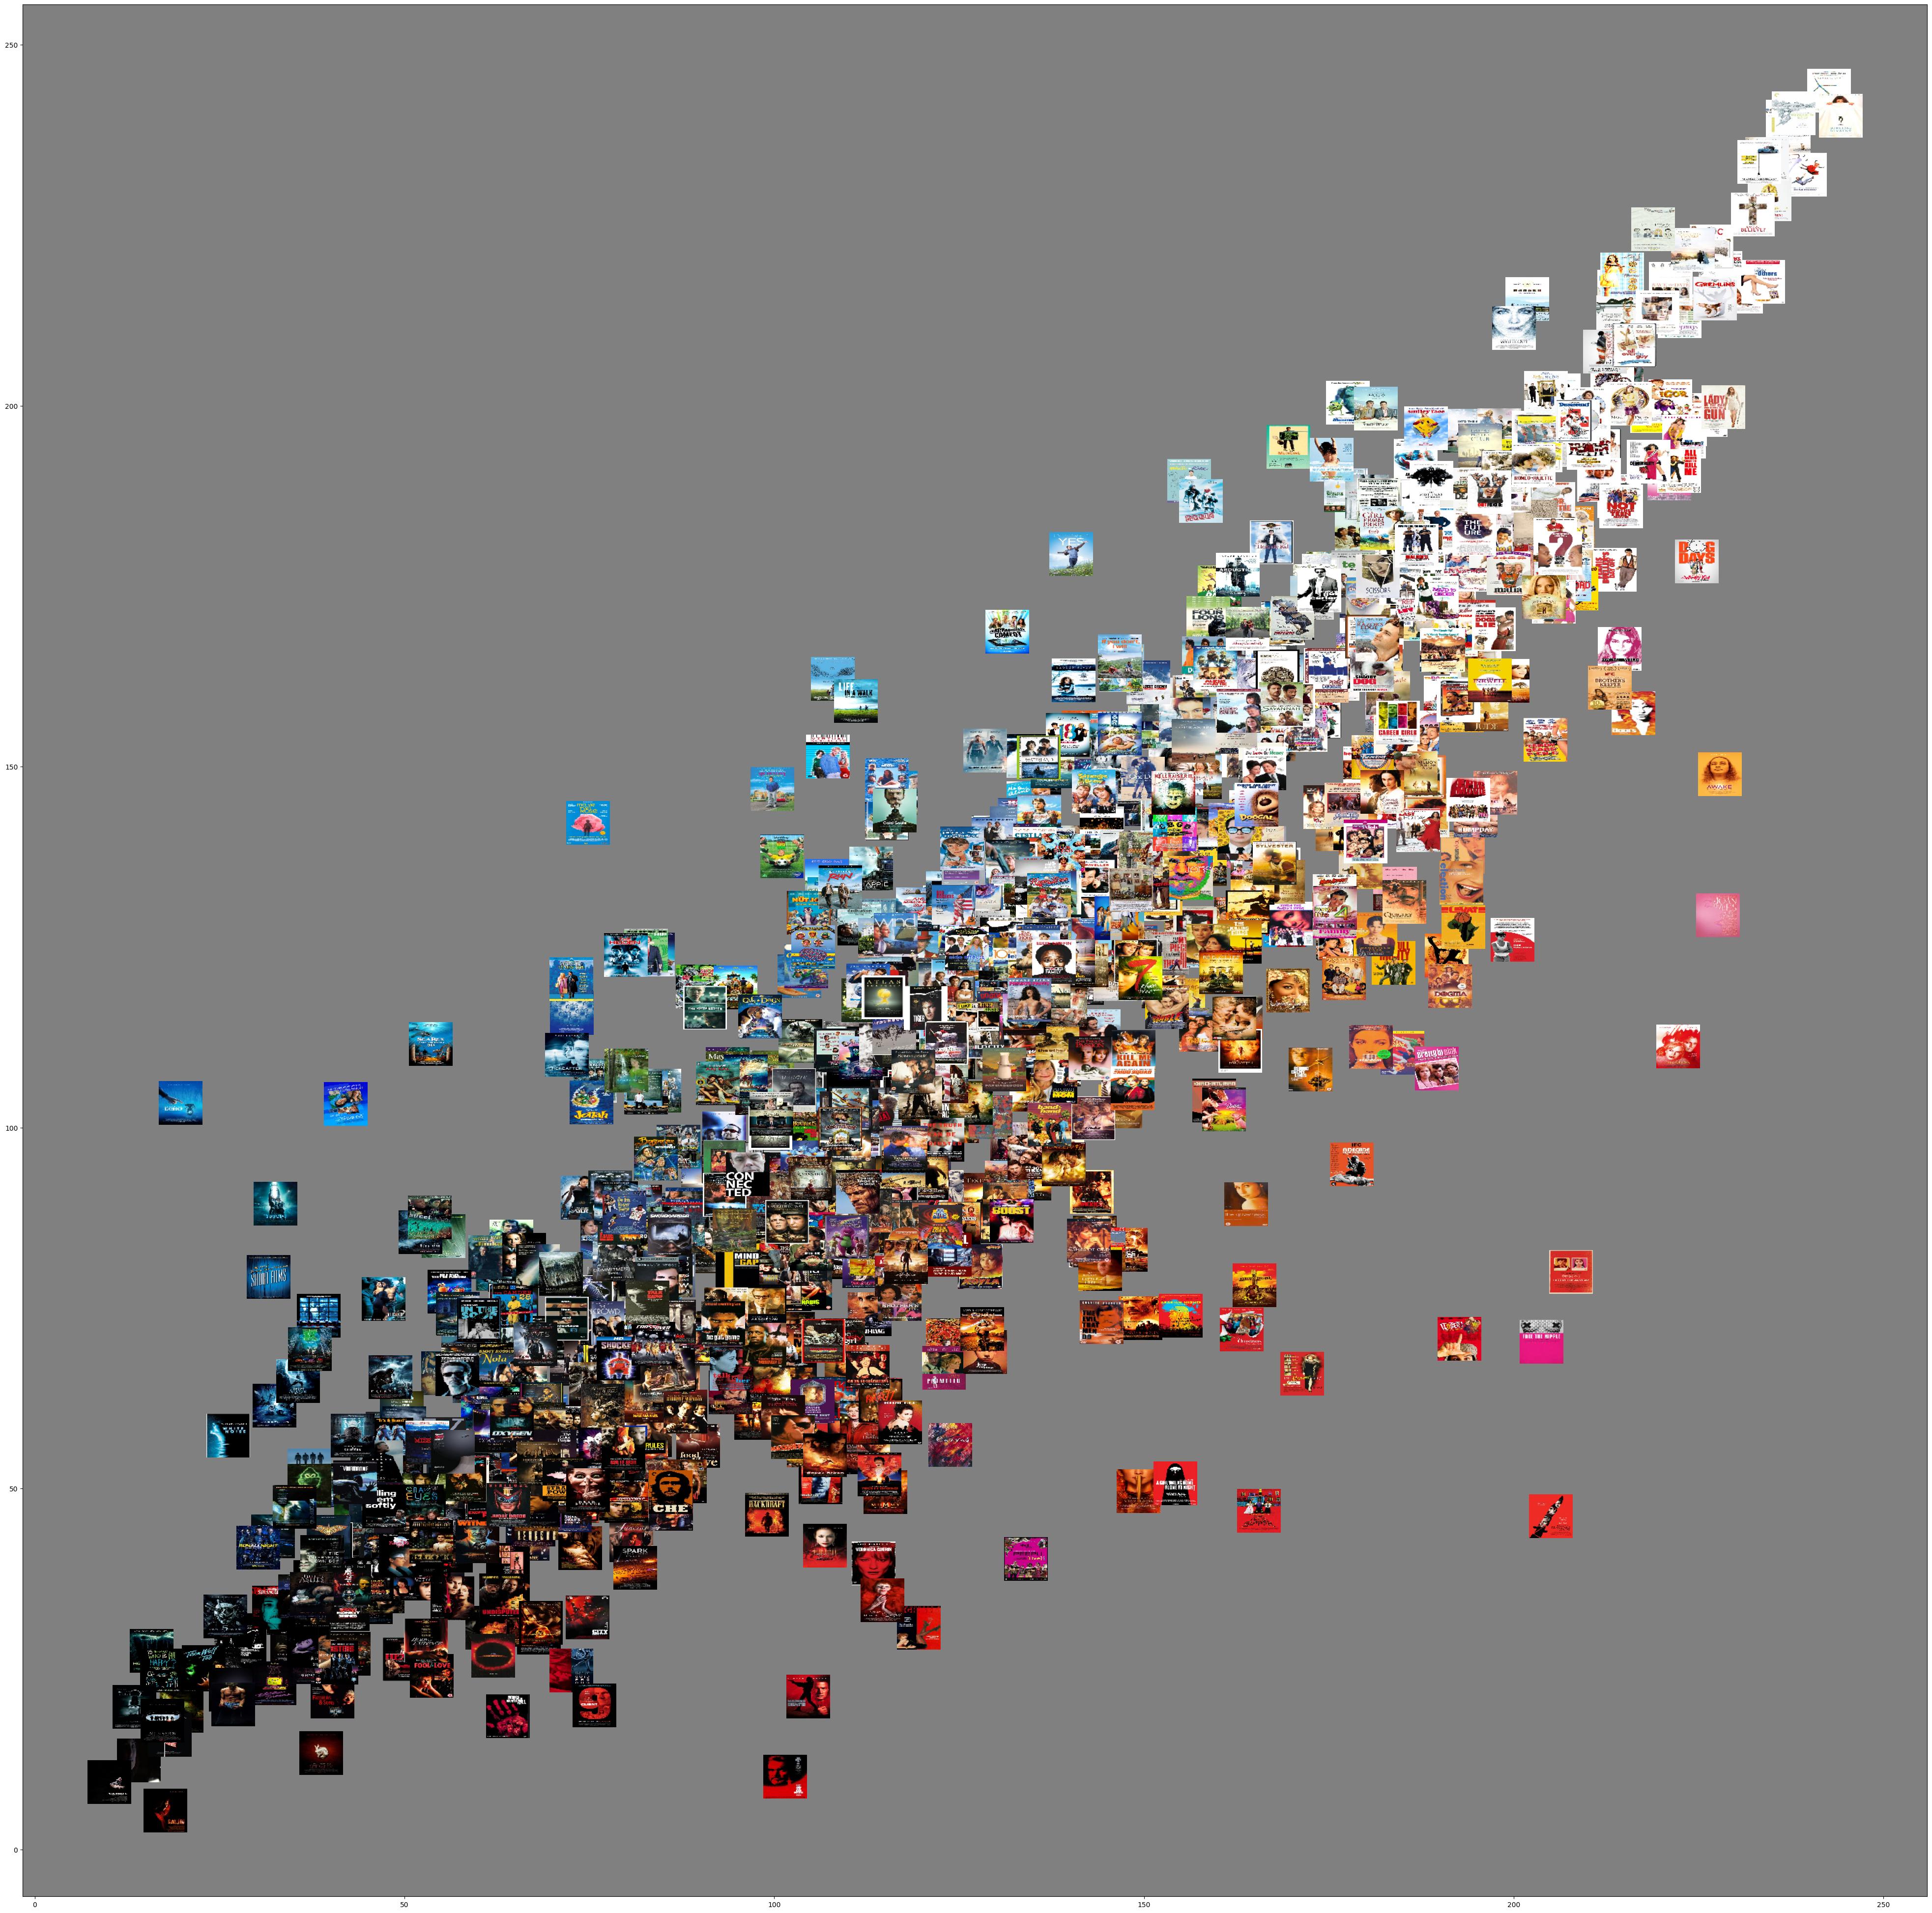
In this example we will use annotations that are much more complex, and a dimensional reduction technique that does not result in meaningful dimensions. This does not sound very appealing but before we will explain the details, have a look at what it does to a collection of the Getty, which comprises of 403 paintings. Please click on it to enlarge and inpsect the relations between the pictures before continuing reading.
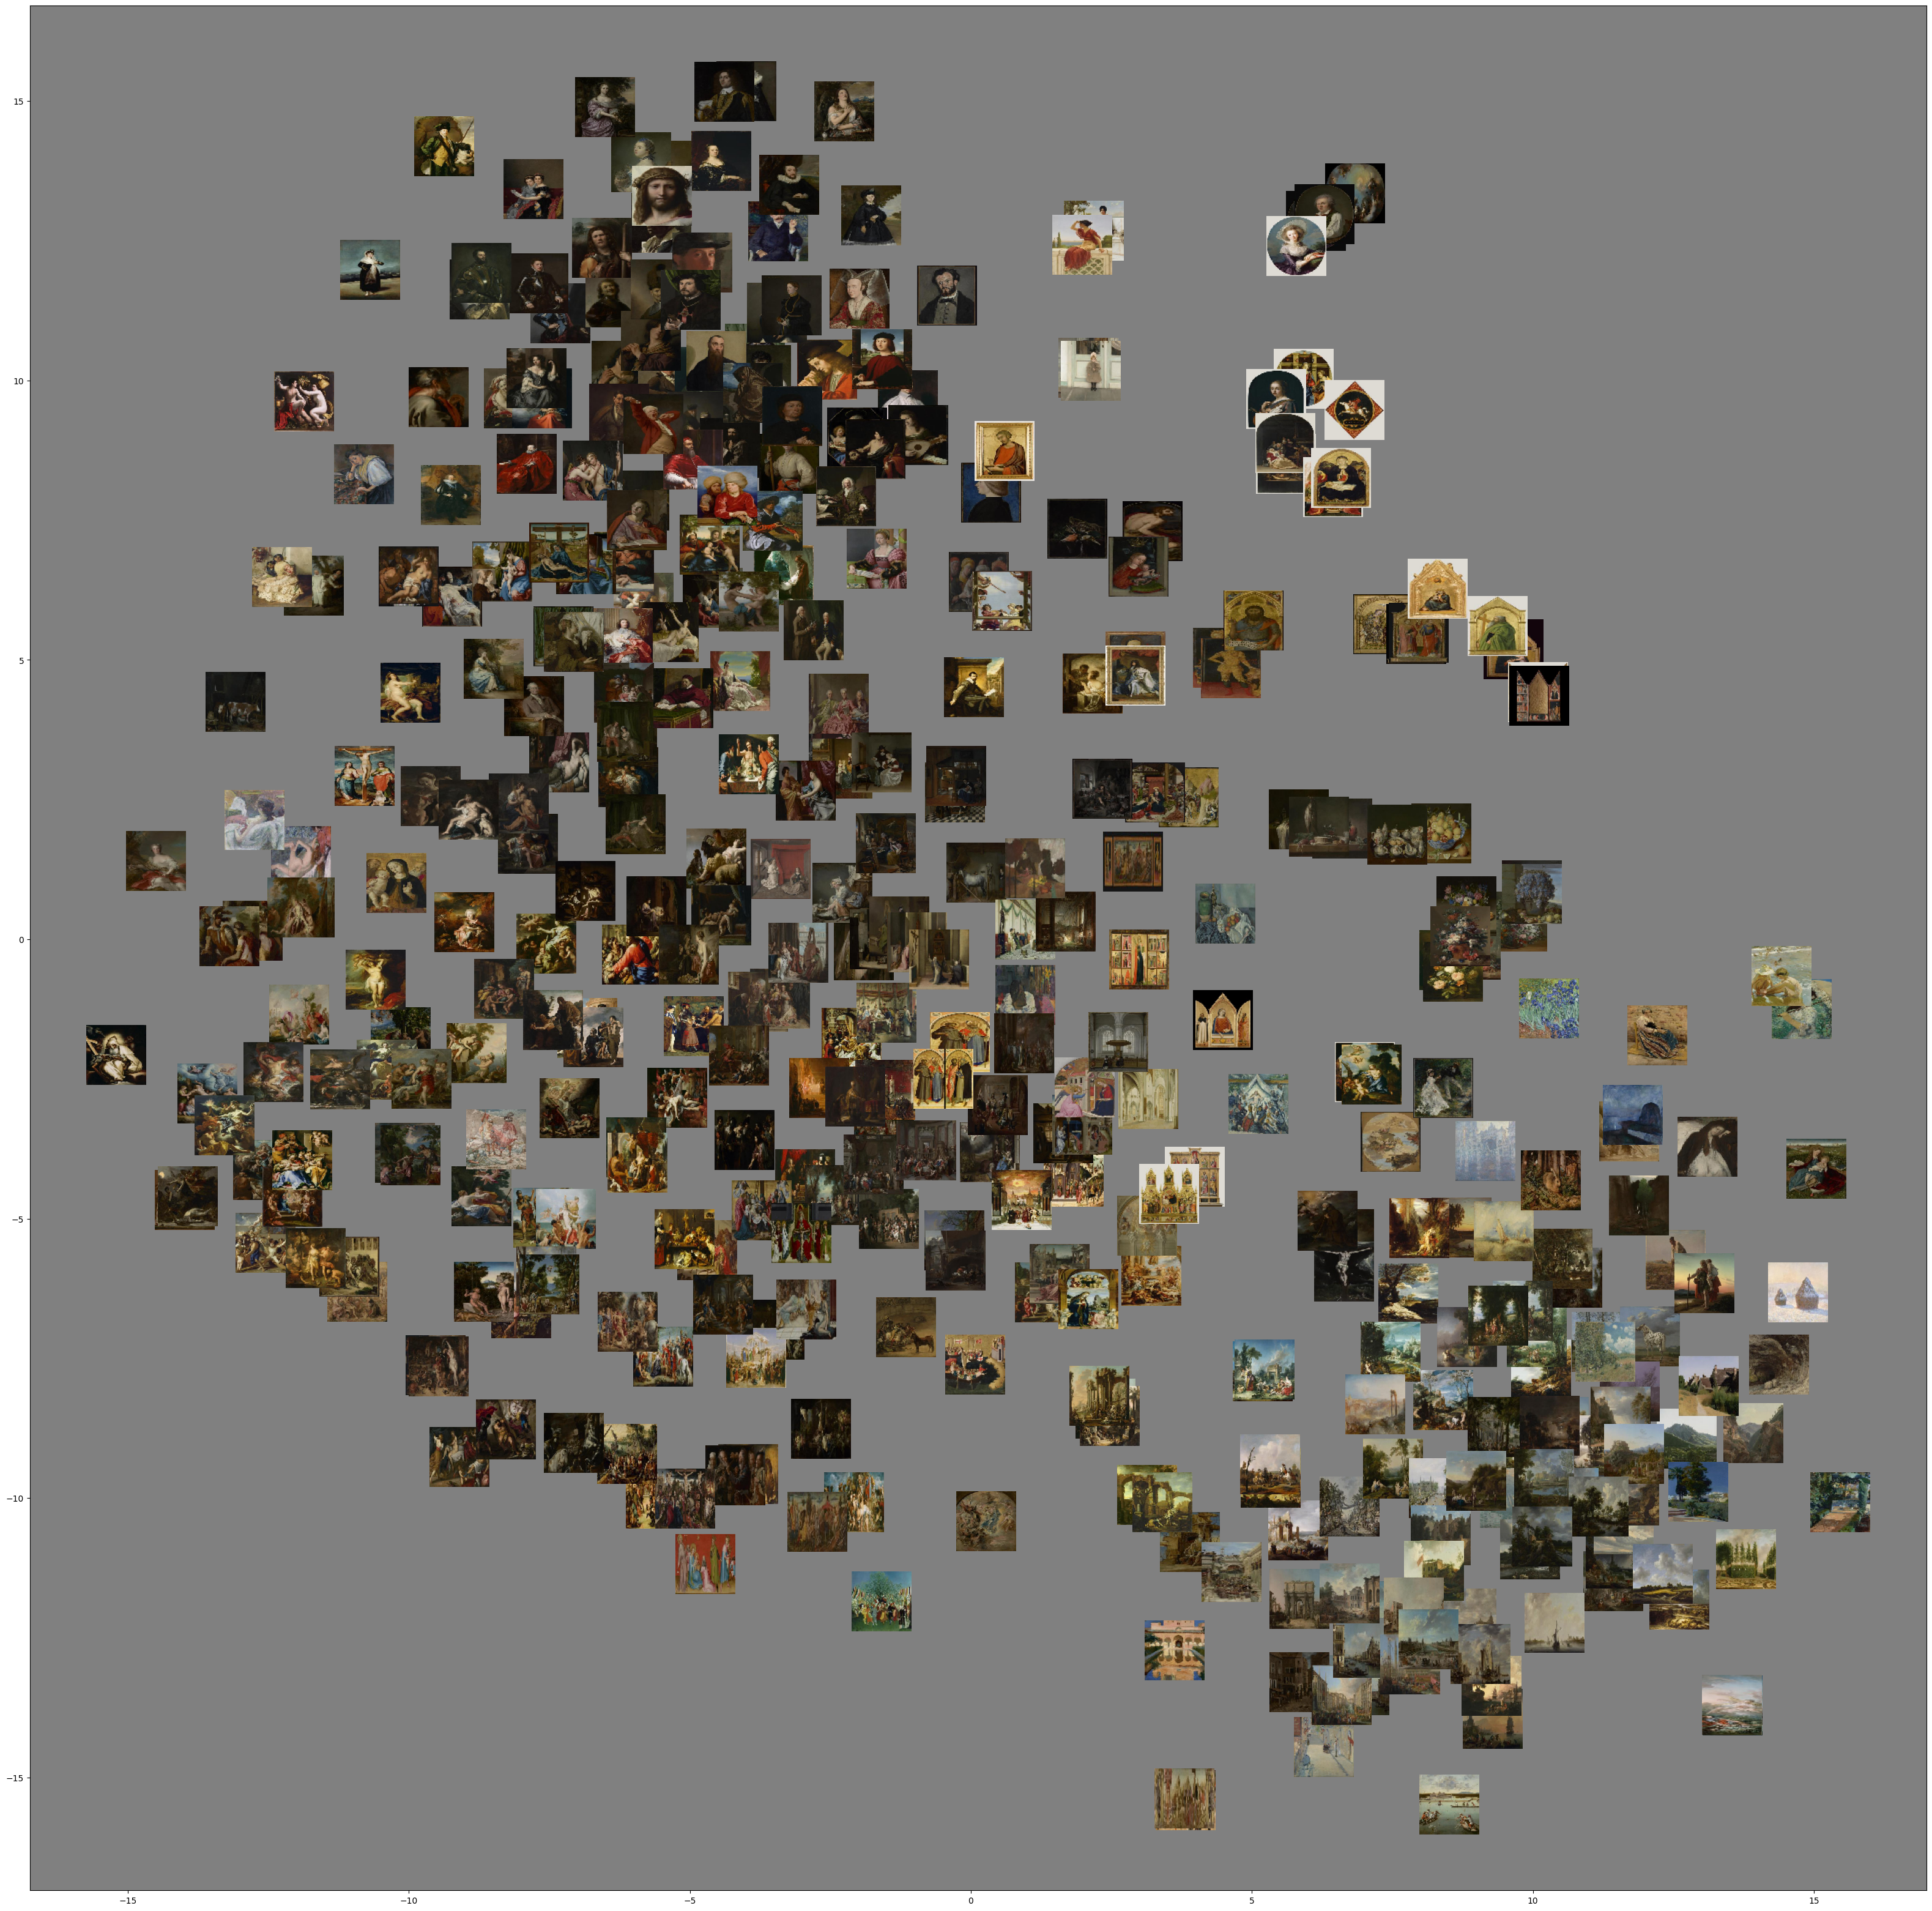
As you probably noticed, the x and y axis do not seem to bear meaning. Yet, there are all kinds of interesting clusters. On top you find the portraits and moving down you see more group portrait, more nudity. Moving right you may see some interiors of similar structure and moving down right you end up at landscapes. Going up, you may also find some still-lifes.
The clusters (rather than the dimensions) are meaningful, and they are based on a neural network that was trained to classify objects: VGG19. The cool thing about these types of networks is that instead of reading out the last layer, which is basically the answer to the classification question, you can read out the layer before that, aka the ‘fully connected layer’. In case of VGG19, that consists of 4096 values. So that’s a whole lot more than the 3 colours! And what this marvellous tSNE does, is reducing these 4096 values to 2. An unimaginable endeavour, but as you saw: it works very well! Back in 2016, it was quite a hit when some people from Google Arts launched their t-SNE Map.
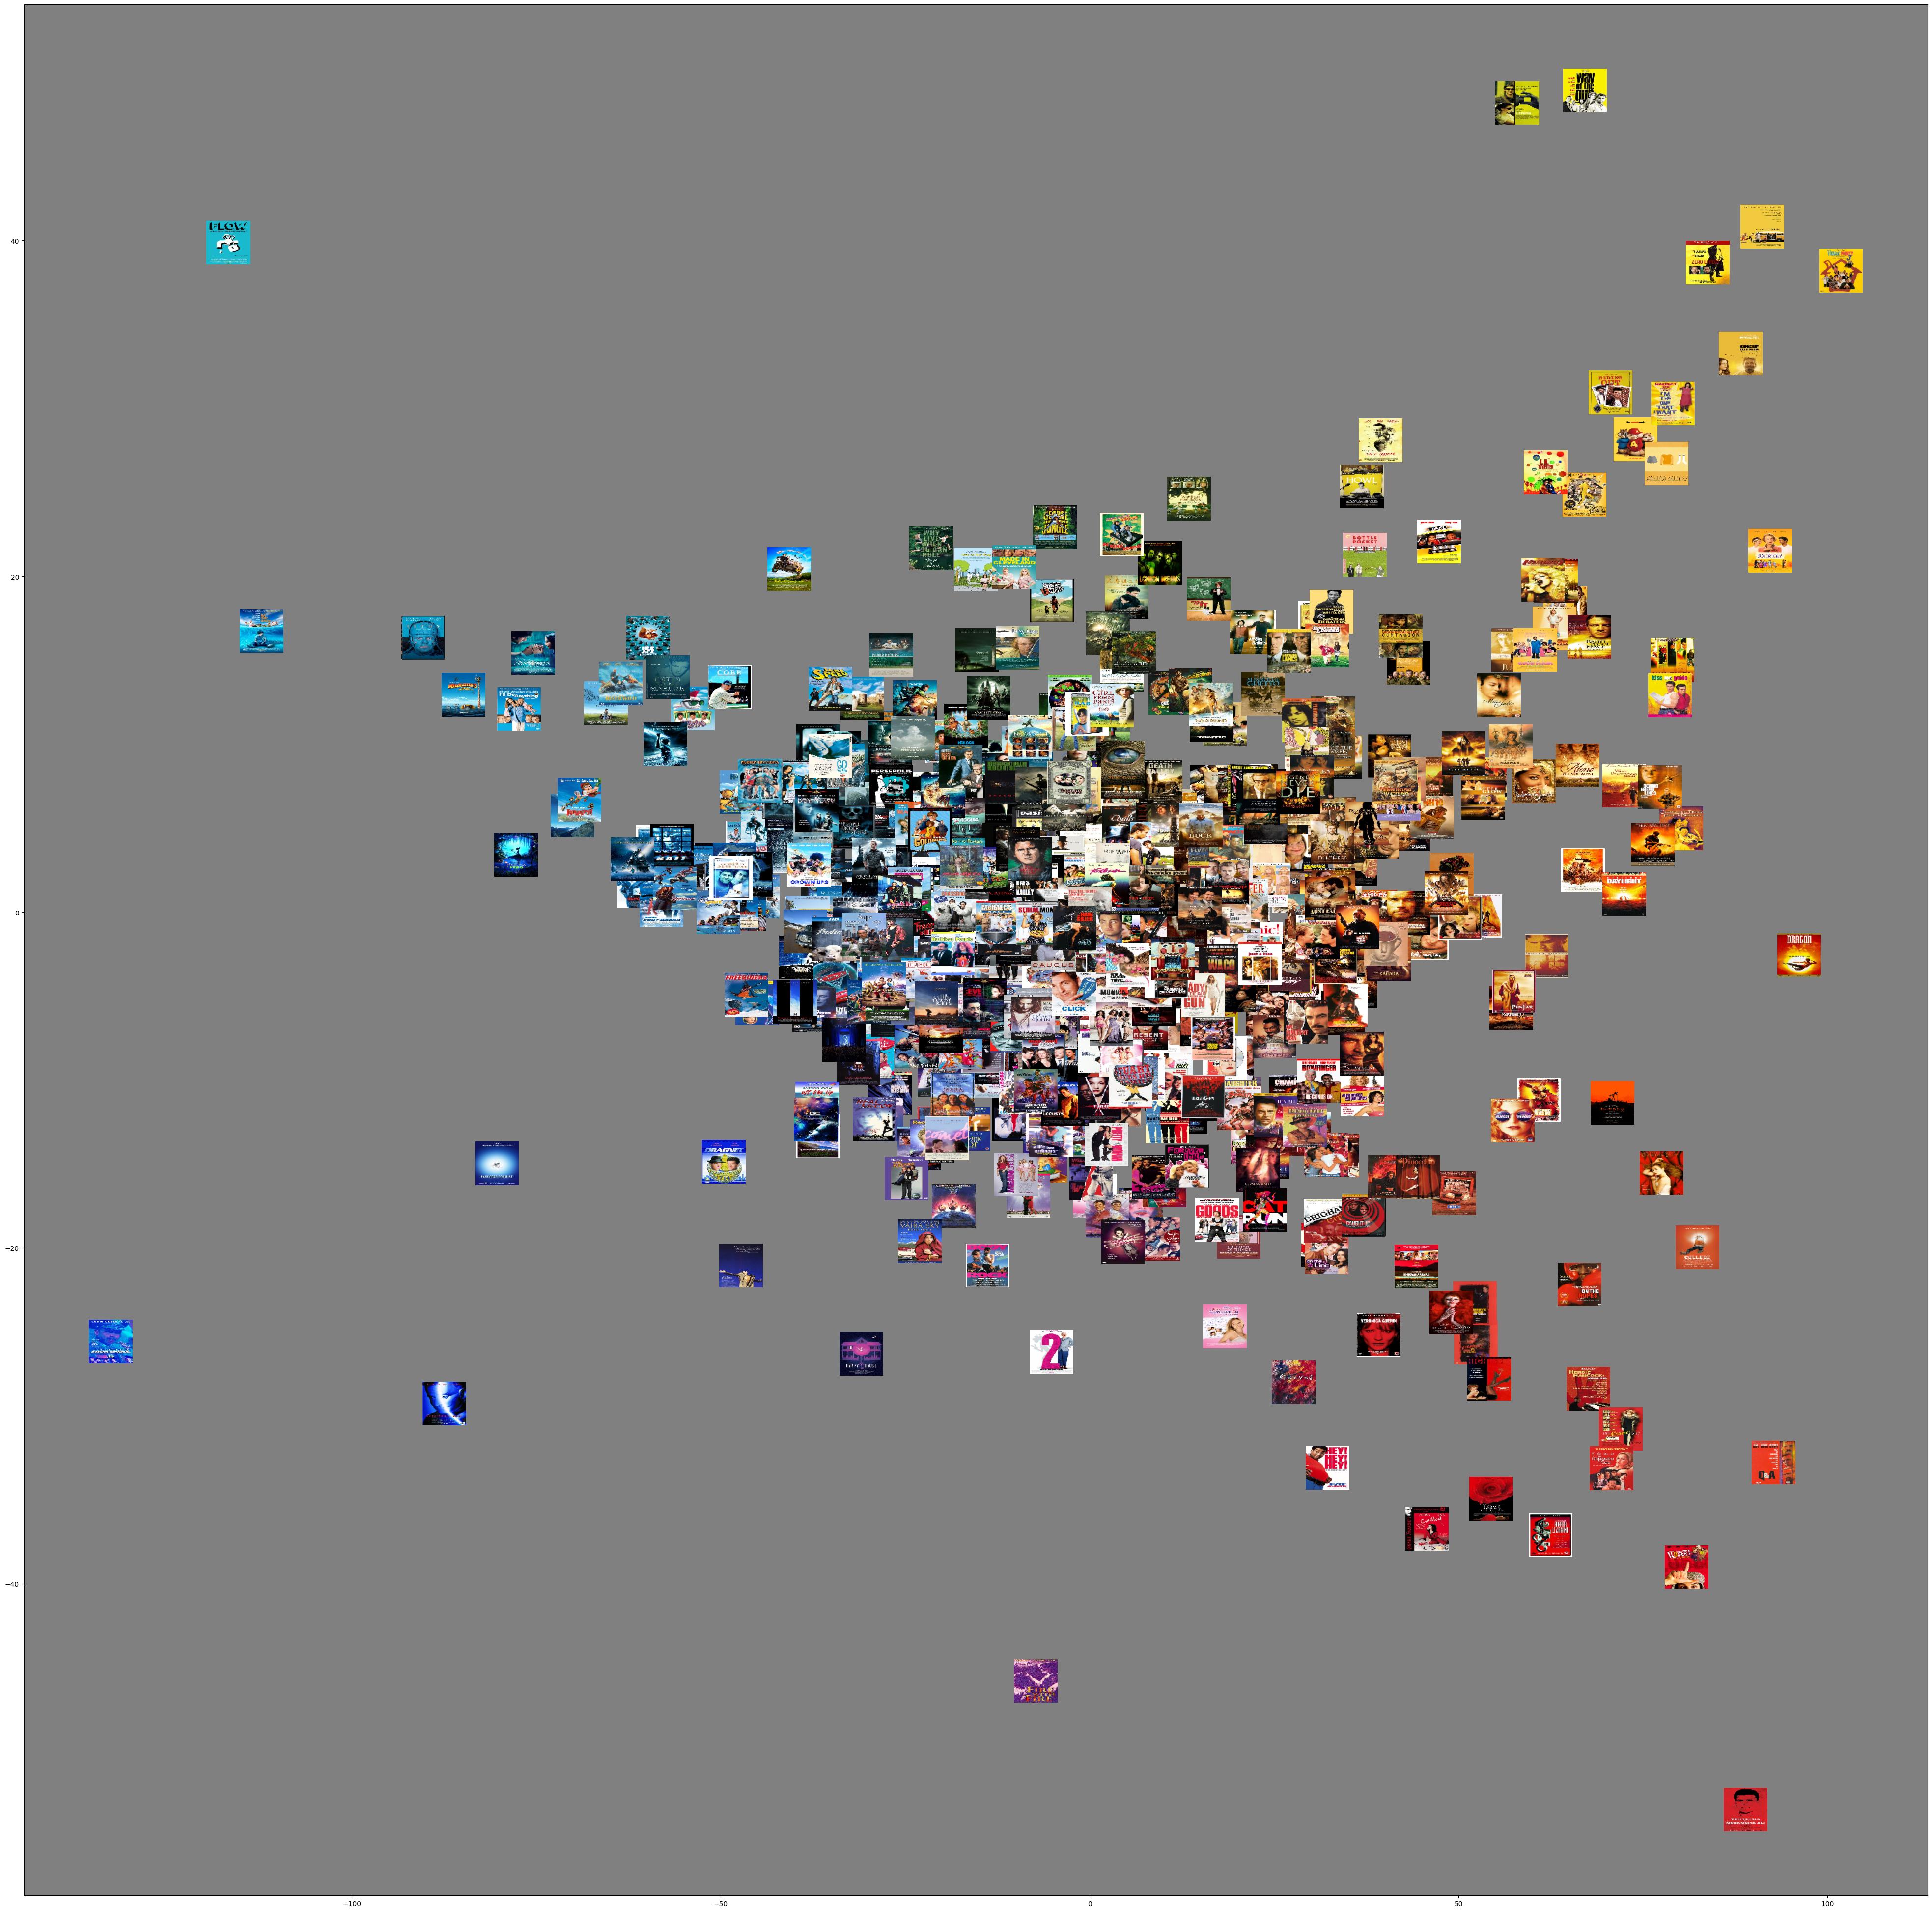
Example 4: Creating metadata with ChatGPT
In the examples above you have to do quite some handwork in retrieving the metadata. With visual inquiries using LMMs (Large Multimodal Models) we can use prompts instead. As we are interested in image sets, we still need some code to run the prompt through all these images, so we stil need python. Moreover, we need to integrate this prompting in python for which we need the API.
You can get access to the API by going to https://platform.openai.com/ and then:
- create an account and put a few dollars on your account.
- Go to settings
- At Billing you can transfer some dollars
- Keep auto recharge off so you do not run into problems!
- Go to API keys and press right top button ‘+Create new secret key’
- After filling in a name and press again ‘Create Secret Key’ *copy the key to a safe place because you will not be able to retrieve it.
- OpenAI does not recommend sharing this key.
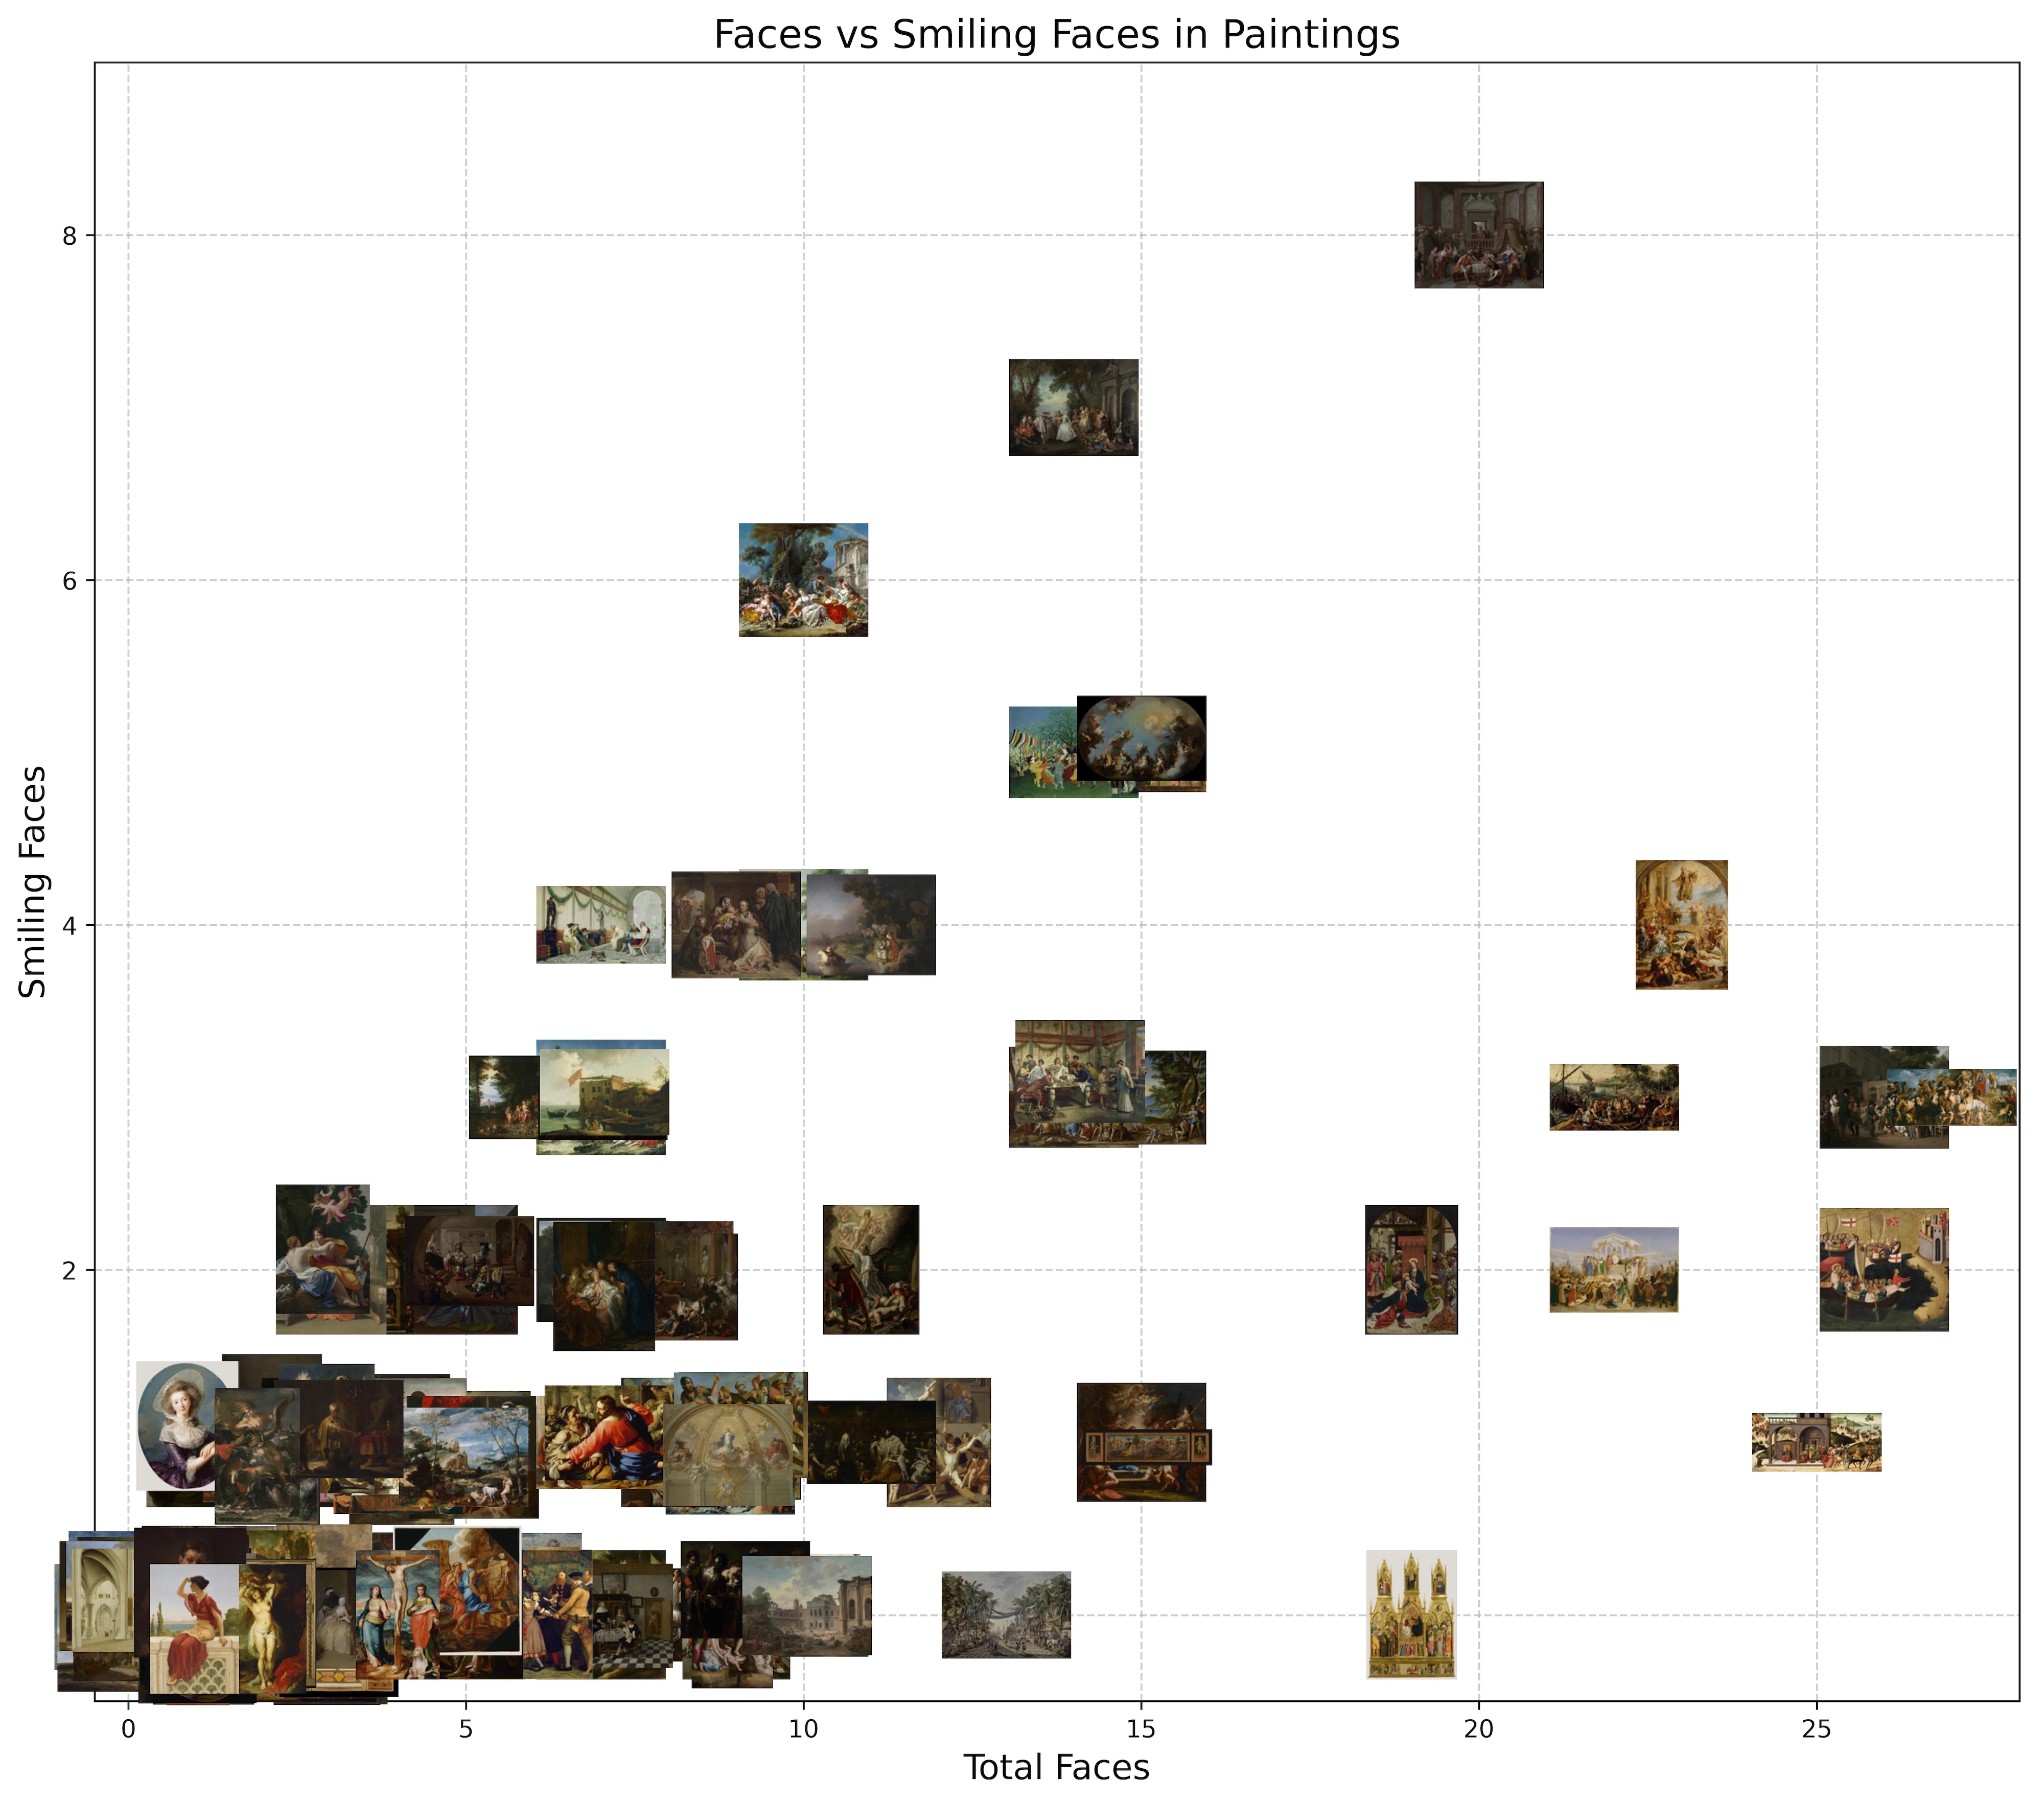
The possibilities are endless but this freedom does come at a cost. If you want to visualise and do some quantitative analysis you still have to convert the ChatGPT response to a number. In our example ChatGPT API Colab we choose to count the number of faces and how many of these faces were smiling. We put these numbers in a table, export it to an excel file and also visualise in a 2D scatter plot: